Daily Archives: October 25, 2012

Descriptio urbis Romae

«La théorie d’Alberti est presque entièrement basée sur le système de notation entre le design et le bâtiment, impliquant que les dessins peuvent et doivent, être identiquement transmis à l’objet tridimensionnel.  Dans sa théorie, le design du bâtiment est l’original, et le bâtiment lui-même est une copie.»  Alberti était véritablement obsédé par la division entre le travail de l’auteur et la reproduction.  Il a inventé plusieurs dispositifs pour faciliter la connexion entre le projet et le bâtiment construit.  En fait, les copistes faisaient souvent des erreurs, parfois ils inventaient, interprétaient ou interpolaient ce qu’ils avaient à copier.  Alberti pensait que des mots et des chiffres pouvaient voyager mieux dans le temps et dans l’espace, plus rapidement et avec moins de risques.  La fidélité d’une copie à la main était inversement proportionnelle à la complexité du dessin, et de sa ressemblance à un archétype (comme une forme géométrique).

Alberti utilisait rarement des illustrations complexes dans ses livres, choisissant simplement de ne pas montrer ce qui était difficilement reproductible.  Il les remplaçait par des descriptions, avec parfois des systèmes composés de lettres et de chiffres.  On pourrait affirmer que déjà, entre 1430 et 1440, dans sa Descriptio urbis Romae, Alberti a créé la toute première image digitalisée, dans un système de coordonnées polaires.  Le lecteur est amené à dessiner lui-même sa carte de Rome, tel un traceur ou une imprimante.  Alberti a utilisé cette idée pour annoter plusieurs bâtiments, objets, peintures, et même des sculptures.  Il a d’ailleurs suggéré l’idée que si des parties d’une sculpture sont produites dans tes ateliers différents, ces parties pourraient s’emboîter parfaitement, comme dans un système préindustriel Tayloriste.  Bien entendu, les inventions d’Alberti ne sont pas parfaites, dû notamment à la technologie elle-même, l’erreur humaine étant toujours possible.

Selon Mario Carpo, dans notre culture Occidentale moderne nous assistons à l’inversion du paradigme Albertien.  L’ère digitale a fortement déterminé les bases et les standards en architecture.  Il est maintenant possible de reproduire des copies parfaitement identiques, mécaniquement, et cela a un impact sur notre environnement construit.  Cela affecte indéniablement notre culture visuelle et nos fonctions et valeurs de signes.

Source : The Alphabet and the Algorithm, Mario Carpo

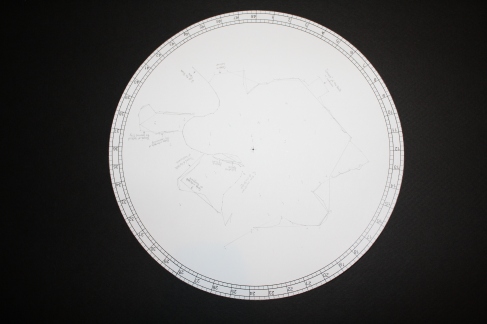
La carte réalisée fait un diamètre de 400 mm et a été entièrement dessinée à la main à la plume fontaine et au crayon à la mine sur du carton.  La règle est en bois (tilleul).

«Alberti’s entire architectural theory is predicated on the notational sameness between design and building, implying that drawings can, and must, be identically translated into three-dimensional objects.  In Alberti’s theory, the design of a building is the original, and the building is a copy.»  He was obsessed by the division between the work of the author and the reproduction.  Alberti made a lot of inventions to facilitate the translation between the project to the constructed building.  In fact, the copyists often make mistakes, sometimes they can invent, interpretate or interpolate what they have to copy.  Alberti thought that texts and numbers could better travel in time and space, faster and more safely than images.  The fidelity of a handmade copy drawing was an inverse proportion to the complexity of the drawing, and of its distance from the archetype (like simple geometries).

Alberti rarely used complex illustrations in his books, he simply chose to not show what is hardly reproductible.  He replaced them by descriptions, with numerical or letter-based strategies.  We could say that even around 1430-1440, In the Descriptio urbis Romae, Alberti has created the first digitalised image using a system of polar coordinates.  Then, the reader is involved in a DIY process, where he is the «plotter» of the image.  Alberti used the same idea to notate buildings, objects, paintings and sculptures, he even suggested that the parts could be produced in different workshops and they would fit perfectly, like in a pre-industrial, taylorist system.  Of course, that system is not perfect because of the technology itself, in those inventions the human mistake is still possible in the process.

According to Mario Carpo, in our modern Western culture, we assist at the reversal of the Albertian Paradigm.  The digital time have determined a lot of the basics and the standards in architecture.  It can produce exactly repeatable, mechanical imprints and it has an impact on our visual envrionnement.  It indeniably affects our visual culture, our functions and values of signs.

Source : The Alphabet and the Algorithm, Mario Carpo

The map realized is all drawn by hand with fountain pen and pencil on thick paper, the map has a diameter of 400 mm.  The rule is in wood.

Émélie DT

This slideshow requires JavaScript.

Saphea Arzachelis

L’astrolabe est daté de 1551 et est signé par Antoine Mestrel, à Paris.  Il est fabriqué en laiton, et son diamètre fait 257 millimètres.  Le plateau principal contient cinq échelles différentes (de l’intérieur vers l’extérieur): les heures, les signes du zodiaque, le carré d’ombre et un diagramme qui sert à convertir deux différents systèmes d’heures (appelés UNEQUALES).  Les étoiles sont également inscrites selon leurs positions dans le zodiaque.

Cet astrolabe n’est pas dessiné pour une latitude spécifique puisqu’il est dit universel, (lat. Saphea Arzachelis).  Sa construction fut probablement influencée par le mathématicien espagnol Juan de Rojas puisque ce dernier a publié la même année un livre traitant de la projection orthographique et certains détails sont fortement similaires, comme le trône décoratif.

Il est marquée d’une échelle allant de 0 à 90 avec des hachures à chaque unité d’angle.  Les lignes d’ascension entre l’arctique et l’antarctique (POLVS ARCTICUS et POLVS ARTARCTICVS) sont divisés en 4 minutes par des traits.  Entre les tropiques, des lignes sont à chaque 2 degrés et illustent la position du soleil dans l’ecliptique.  Des signes du zodiaque sont dessinés le long du diamètre vertical.  Au-dessus de HOROE ANTE MERIDIEM et HORAE POST MERIDIEM des heures sont inscrites (de 1 à 12).  Quelques étoiles sont positionnées et marquées.

La règle, ou l’aiguille est une échelle de minutes, allant de 0 à 360.  La façon de l’utiliser est de la rotationner dans le sens contraire des aiguilles d’une montre à l’angle de la co-latitude (90 degrés moins la latitude locale).  Cela peut déterminer la position des étoiles à minuit, au solstice d’été.  Il est possible ensuite de calculer la position des étoiles sachant qu’elles se trouvent à la même position deux heures plus tard à chaque mois précédant.  La trajectoire d’une étoile peut être suivie selon l’arc parallèle la plus près.  La deuxième fonction de l’astrolabe est de déterminer la position du selon l’heure et la date, en déterminant la position du lever et coucher du soleil ainsi que le crépuscule.  Il suffit de trouver la position du soleil sur le zodiac et ensuite sur la ligne écliptique (la ligne diagonale).

Le modèle ci-construit est à l’échelle 1:1 de l’original, dessiné à la main au crayon de mine HB sur un carton.  Cet astrolabe fait actuellement partie de la collection du Musée d’histoire et de science à Oxford.

The astrolabe is dated of 1551 and is signed by Antoine Mestrel, in Paris.  It is made of brass, and has a diameter of 257 mm.  The plate contains five scales (from exterior to interior) : the hours, the zodiac signs, a calendar, a shadow square and a diagram for converting time between different systems of hours (called UNEQUALES).  The stars are named according to their position.

The astrolab is not designed for a specific latitude, because this one is universal (lat. Saphea Arzachelis).  This model of astrolabe was probably influenced by the mathematician Juan de Rojas because he has published the same year a book that tells about the orthographic projection of the sky and contains a lot of resemblances like the decorative throne with a head and other technical elements.

It is scaled from 0 to 90 with hatching for every angle.  Ascension lines are drawn for every twelve minutes between the arctic and the antarctic (POLVS ARCTICUS and POLVS ARTARCTICVS) and they are divided in four minutes by little lines.   Between the tropics, lines are at every two degrees and this illustrate the sun position in the ecliptic.  Zodiacal symbols are drawn on the vertical diameter.  Above HOROE ANTE MERIDIEM and HORAE POST MERIDIEM the hours are marked (1 to 12).  Some stars are positioned and marked.

The rule is a scale of minutes (0 to 360). The way to use it is to rotate it anti-clockwise to the angle of the co-latitude (90 degrees minus the latitude).  It can determine the position of the stars at midnight at the summer solstice.  Then it his possible to calculate the other positions of the stars knowing that they are at the same position two hours later for each month earlier.  The track of a star is along the (nearest) parallel arc on the plate.  The second use is to determine the position of the sun at any time and date, with the sunrise, sunset and twilight.  By finding the position of the sun on the zodiac and then on the ecliptic line (the diagonal line).

The present model is at a 1:1 scale of the original and is drawn by hand with a HB pencil on a cardboard.  The astrolabe is presently in the collection of the Museum of history and science in Oxford.

Émélie DT

This slideshow requires JavaScript.

Paper Astrolabe

ImageImage

Astrolabe designed for an android application – location Ottawa, Canada (developer: Robin Davies)

Some of the possible calculations with the astrolabe:
1) tell the time
2) tell what time the sun will rise the next morning
3) calculate how many hours of darkness for a given date

1) – set current calendar date on the back of the base plate with the help of the alidade
– convert to the corresponding astrological date by looking at the intersection or the alidade on the astological dates scale on the back of the base plate
– use the alidade to find the altitude of the brighest known star in the sky (outer scale of the back of the base plate)
– locate the specific star of which you have measured the altitude on the rete (front of astrolabe)
– rotate the rete to align the star with the altitude line that crosses the meridian
– the astrolabe is now set for the specific date
– rotate the rule on the rete according to the astrological date found in the first step
– follow the opposite side of the rule to determine the time of day in solar time

2) – convert the calendar date to the astrological date on the back of the base plate
– on the front of the astrolabe, rotate the rete so that the astrological date intersects the horizon
– determine the time by aligning the rule with the astrological date and follow it to the time scale

3) – convert the calendar date to the astrological date on the back of the base plate
– on the front of the astrolabe, rotate the rete so that the astrological date intersects the horizon
– align the rule to find the time (like opt 2) at each intersection of the rete on the horizon
– determine at what time the sun will rise and set and calculate remaining hours of the day to know how many hours of darkness there will be

Martina’s Map of Rome Part 1

In the 15th century, Alberti was commissioned to carry out a topographical survey of the city of Rome. He invented a mathematical instrument to do so accurately, a technical drawing instrument, which would essentially locate the given sites. The instrument consisted of a circular disk he named, the ‘horizon.’ The circumference of this circle would be equally divided into 48 parts or ‘degrees.’ The distance between these degrees was further divided into 4 parts deemed ‘minutes.’ The completion of the first part of the instrument is now complete. 

The ‘spoke’ will act as the rule of this circle and will rotate around it’s centre. Its length is equal to the radius of the circle. It is divided into 50 equal segments (degrees) and then further divided into 4 minutes. Once the spoke is in place, we are able to start depicting points and measurements from Alberti’s tables. For instance, if given ‘coordinates’ for the Porta Portuense (Horizon: 27degrees, 3minutes and Spoke:26degrees, 2minutes) then we locate them on the horizon and spoke appropriately. Finally, he differentiates the technique between apexes and corners. Points of an apex should be curved and not simply connected in a direct straight path.

Brian’s Horizon Tool – Drawing a Map of Rome

This slideshow requires JavaScript.

Above are two versions of the Horizon tool invented and described by Leon Battista Alberti to allow a man of average intellect to accurately draw the map of Rome.

The tools have been cut to a 15″ diameter to allow for a decently scaled map. A second Spokeless version of the toll was created for more accurate plotting (as opposed to the previous version being interrupted with spokes).

Synopsis: 

After having read Alberti’s description of the construction the “Horizon” tool it becomes clear that this tool is made only to replicate his initial surveying studies. There is some complexity when he begins to differentiated a corner from an apex, consequentially suggesting different drawing rules when constructing the lines through the co-ordinates.

I would imagine that because the grid used to initially survey City Walls was a radial one as opposed to an orthogonal grid, that it would have been quite difficult to locate the co-ordinates (possibly having to return to the Capitol to count the number of steps for every important corner, apex or gate).

Martina ‘s Mariner’s Astrolabe

 The mariner’s astrolabe was a navigational device that was extensively used at sea from 1460 through to the eighteenth century. Comparing it to the more ornamented, exuberantly detailed astrolabes at the time, the mariner’s astrolabe is much simpler. Made to withstand the harsh conditions on a ship, its functional based design consisted of a heavy brass material and perforations in its base plate to let the wind pass through. Stripped of the complex scales and stereographic projections, it contained only a simple graduated scale in degrees and an alidade for measuring the altitude of the sun or for sighting stars.

How to measure the height of the sun / star:

  1. Hold the astrolabe at eye level
  2. Rotate the alidade and aline it with the sun or north star
  3. The angle noted is the angle above the horizon thereby giving the ships latitude 

How to measure the height of a building:

  1. Chose a building and measure the distance you stand away from it
  2. Rotate the alidade and aline it with the top of the building
  3. Pythagorus (tan of the angle noted X the distance you stood from the building)
  4. To be more accurate, add your height to the value calculated in 3

Astrolabe – Amalie Lambert

How to tell the time during the day:

Hold the astrolabe at eye level.
Using the sights on the alidade, align them so the sun passes through both of them.
Note the angle of the alidade at this point (let’s say it’s at 30 degrees, in the morning).
Align the alidade with the calendar date. Note the corresponding (aligned) zodiac date. This
indicates the Sun’s position on the ecliptic (let’s say it’s Pisces 25).
5. Turn the astrolabe over. Align the zodiac date on the ecliptic with the correct angle of the sun.
(Pisces 25 on 30 degrees). We will use the East/left side of the plate because it is the morning
(we would use the West side in the afternoon).
6. Rotate the rule so it aligns with Pisces 25. This gives us the current solar time on the outer scale.
As my astrolabe does not have time markings, the user would find the time by assigning the 12
am value to the 180 degree marking, and counting each subsequent hour at 15 degree intervals,
going clockwise.

How to tell the time at night:

1. Hold the astrolabe at eye level.
2. Using the sights on the alidade, align them so that a chosen star (let’s say Cor Leonis)is seen
through both.
3. Note the angle of the alidade (let’s say 40 degrees).
4. Align the alidade with the calendar date. Note the corresponding zodiac date (once again, let’s
say Pisces 25).
5. Turn the astrolabe over. Align Cor Leonis’ star pointer with the 40 degree almucantar (or
altitude circle). There are once again two options: one can align on the East or the West side
of the plate. The University of Hawaii website recommends doing both the readings (East
and West) with two different stars. From the four results (completing all 5 steps), two will
correspond, thus giving the correct time.
6. Finally, rotate the rule so it aligns with Pisces 25 on the ecliptic. By following the above
recommendations, we shall once again find the solar time.

To find “legal time” (the one on your watch), the modern user would take into account (a) latitude, (b)
the difference between Real (or Apparent) Solar Time (as calculated on the astrolabe) and Mean Solar
Time (the time on the clock), and finally, (c) daylight savings.

Phillipe Dutarte’s website explains this well for modern astrolabes: http://dutarte.perso.neuf.fr/
instruments/how%20to%20use.htm

Brian’s Astrolabe

An Astrolabe used to treat the Humours

The astrolabe above can be used find the location of the stars above the person in question at his/her place and time of birth. This tool became useful to doctors attempting to treat or balance a patients emotional instabilities. By reading the stars (zodiac) that blanketed the sky at the time and place of their birth the medical doctor could prescribe counter measures to balance out the temperaments of the four Humours that people are influenced by.

Construction

Cardstock 80lb

Acetate

Pivot Clip

How to use the Astrolabe

Use the back of the astrolabe to find the date in question in the calendar. Move the label round until it lines up with this date. Then read along the line of the label to see the position in the Zodiac calendar. On the front of the Astrolabe, line up the rule with the Zodiac unit found on the rete. Holding both rule at rete (fixed together), rotate the rete until the rule reaches the time of birth of the patient.

Having followed these instructions, all the stars that fall within the horizon line should be the project of stars at the time of the patients birth. Provide Prescription accordingly.

Noushig’s Construction of an Astrolabe


Components of the Astrolabe

My astrolabe is composed of a double rule, rete, mater and alidade. On the mater I have drawn the Montreal sky (45°N, 73°W). This projection of the sky includes almucantars and azimuths lines. Almucantars represent the degrees above the horizon while azimuth lines show compass directions. 

On the limb of the mater you can find the 24hours in a day written in roman numerals.

The rete illustrates the stars and constellations in the sky. The sun’s annual path, the ecliptic, is also on the rete; it is the off-center circle with the zodiac date. The rete can display the local view of the sky at any date and time in the year.

How to Use the Astrolabe

Finding the Zodiac Date

We can find the zodiac date by using the back of the astrolabe. By aligning the alidade to the day and month of the year, it then points to the equivalent Zodiac Date.

Finding the Location of a Star

The astrolabe must first be placed parallel and in front of your eye. Once the star, sun or object can be seen, the sights on the rule should be pointing towards the object. By keeping the rule in place and bringing the astrolabe back down, the location of the object can be read off of the azimuth and almucantar lines.

The location of the sun can also be found just with the date and time. If we align the rule with the zodiac date on the rete and the time of day on the limb, it will be pointing towards the sun’s angle and location.

Finding the Time

The time of day can be determined using the date and locate the angle of the sun (or a specific star). The date can be translated on the back of the mater and the angle of the sun or star can be read off the front with the rule pointing directly at it.

Next align the zodiac date on the rete with the location of the sun.

Finally, the rule can be aligned with the zodiac date on the rete. By doing so, the rete is pointing directly at the time located on the limb of the mater and the orientation of the rete shows the local sky.

Map Of Rome


The study focused on an extract from Leon Battista Alberti’s book entitled Delineation of the city of Rome, published around the 1450’s. Alberti describes an instrument that he has invented which permits any individual, “even a man endowed with an average intellect” to map the city of Rome. The map, as Alberti describes, works following two scale systems; one of direction and one of distance. If you have these two givens, you are able to place any point in Rome on the map.

Paper astrolabe by Peter Jordan, Mainz, 1535

The image above dispays a paper astrolabe found in Peter Jordan’s printed edition of Johannes Stoffler’s book entitled Elucidatio fabricae ususque astrolabii, 1513. In this book, he explains the procedure for both building an astrolabe as well as using it. Since both Peter Jordan and Johannes Stoffler were german, the assumption has been made that the plate’s altitude lines correspond to the latitude of the country itself which is around 50 degrees.

Antony’s Map of Rome

Image

Created on thick stock paper using Alberti’s Horizon instrument. 380mm diameter. 

Alberti’s Horizon is an instrument that allows any person to recreate the map of Rome using a radial co-ordinate system invented by Alberti. The city walls, gates, river and significant buildings were all measured and mapped from a central point in the city, each being given a radial distance (on a horizontal plane) and degrees from N at the central point. These are laid out in tables so that they can be transcribed using the instrument.

The horizon instrument is made up of a ring of a user defined diameter divided into 48 degrees and 4minutes per degree. A rule divided into 50 sections with each section containing 4 minutes sits so that it pivots from the centre allowing for radial measurements.

Users therefore read off the co-ordinates from the tables and find them using the rule. For example a co-ordinate of 28’3″, 43’2″ would be found by rotating the rule to an angle of 28 degrees and 3 minutes, then reading off the rule the point of 43’2″ and mark this on the page. This is continued through all the tables and in the case of the walls of the city require you to join the dots to form the map.

Lyndsay’s Map of Rome

In the 15th century, Battista Alberti documented the location of the buildings, monuments, gates and even the outlines of hills that exist within the city of Rome. He then contrived an instrument that utilizes this information, in order to map what Rome looked like in that era. This instrument is comprised of two components. The first is a scaled circle, which can made bigger or smaller depending on the desired size of the projection. The circle is called the horizon and is divided into 48 equal parts. These divisions are referred to as degrees. The degrees are then further subdivided into four parts, which Alberti coined as minutes. The second component is called the spoke. The spoke is a straight rule that revolves around the center point of the horizon and spans the radius of the circle. The rule is divided into 50 equal parts and subdivided into equal fourths.

After recording the location of the elements of Rome, Alberti consolidated his data into 8 specific tables. For each corner point, he indicates the degree along the horizon and measure along the spoke. Once each point is plotted, the user connects the dots using both straight and curved lines to compose the map. The type of line used to connect the dots is determined by which table that specific point is listed under. The tables entitled Corners indicate the use of straight lines where those entitles Apexes indicate the vertex of curves.

Lyndsay’s Paper Astrolabe

This astrolabe dates back to 1555 and was constructed by Michael Piquer, in Louvain. The base plate is unique in that it is engraved with two different latitudes. Divided in halves, this plate shows latitudes ranging from 33 to 36 degrees on the left and 39 to 42 degrees on the right.

This astrolabe can be used to determine the time of day in reference to the position of a specific star in the sky. In order to measure the time, the user will hold the instrument by the ring and look through the holes on the alidade to align the rule with the star. The alignment of the rule on the inner scale of the mater indicates the altitude of the star in degrees. The user then locates the specific star on the rete. The stars are indicated on the rete with flame-shaped pointers, which are labeled by name, planetary symbol and magnitude. The user must align the specific star pointer with the altitude circle that corresponds to the degree that was measured by the alidade. The alidade is then aligned with the present date found on the ecliptic. Finally, the date can be read on the outer scale of the mater, which is scaled by hour and divided into four minutes of time.

The back of this instrument is interesting as it consists of a universal orthographic project. This enables the user to find the time of sunrise and sunset from any location around the world.

Antony’s Replica of an Astrolabe


Instrument: 14th Century European Astrolabe

Maker: Unknown

Material: Brass

Plates: 40 – 45 degrees N

Plate replicated: 43 degrees N

Instructions

To determine the time of day or night:

Begin by measuring the angle of a specific star (or the sun) using the alidade on the back. This piece has two small holes to look through as you hold the astrolabe from a ring attached to the top (if aiming at the sun do not look through the alidade but instead align it as such so that a beam of light passes through both holes onto a surface near you). Once our view is aligned read off the angle of the sun or star on the outer edge.

Flip over the astrolabe and position your star to the correct altitude by rotating the rete. (If measuring the suns angle you have to know the date according to the zodiac and use the eclipse on the rete.) Double check with a compass to determine which side of the projection your star should be. Once positioned you can use the rule to read off the time of day. On this particular astrolabe there are no times displayed but it is marked at 15 degree intervals that correspond to an hour of the day. E and W mark 6am/pm respectively.

For the sun you need to position the correct date on the eclipse with the angle of the sun determined and again use the rule to measure off the time of day.

To determine sunrise and sunset times:

Select your correct date according to the zodiac and line up the corresponding mark on the eclipse with the corresponding side of the horizon line. Left side being East therefore sunrise and the right side being West therefore sunset.

Synopsis

Leon Battista Alberti, fascinated by ancient Rome, creates a device that would allow him to trace the plan of the old city on any surface.  His device, based on a simplified volvelle is a basic gridded circle and a ruler.  The circle, which Alberti describes as the horizon and of the diameter the reproducer chooses, is subdivided in 48 even degrees.  These degrees are then subdivided in four that Alberti names minutes.  The ruler, called by author the Spoke, is also a very simple device.  The length of half the diameter of the circle, it is subdivided in 50 degrees.  These are also subdivided in four minutes.  The two elements, horizon and spoke are joined at the center of the circle by a pin that allows the ruler to revolve 360 degrees.

Joined with the text are a series of informative tables positioning specific points.  These points represent corners of walls, gates in fortified walls or landmarks.  These points are positioned by placing the spoke aligned with the right degree of the horizon and measuring on the spoke the right degree and minute.  This point should then be in the right position in comparison to all other points that will be positioned on the horizon.  Playing connect the dots, the points can then be connected by straight or curved lines to create the plan of ancient Rome.  Voilà!

Proposed instrument

The proposed instrument would be one for educational purposes.  The horizon would be about 12” of diameter and engraved onto a Plexiglas sheet.  The spoke would be made of Plexiglas.  The instrument could then be used by drawing the map with erasable colored pens allowing the exercise to be reproduced.  The instrument would be a great example of a radial cartography system and could be used to survey other spaces or cities.  One could also put to charts the general layout of city based on a printed map.

___________________

Other images to come

Jean-Roch’s rendition of Alberti’s Delineation of the City of Rome

In the text called Delineation of the City of Rome, Alberti describes a tool and its instructions to follow in order to replicate a precise map of Rome. Using a circle divided into 48 degrees and 192 minutes called the “horizon” and a “spoke” the length of the radius of that circle divided into 50 degrees and 200 minutes, he explains how to plot a series of points within the horizon, similarly to a cartesian grid. He then lists multiple tables of points corresponding to various monuments, roads, river, walls and buildings according to their position in the city Rome, either as “corners” or “apexes”, meaning the meeting of two lines or two curves. Once all the corners and apexes are connected together, the result should be an accurate map of Rome proportionally sized to the dimension of the circle originally drawn.

In order to gather those tables of points that represent the positions of different elements of Rome, Alberti created a tool with which he could determine the position of a monument in degrees on the horizon. Standing still at a single point (which corresponds to the center of the circle on the map), Alberti looked through an instrument that allowed him to tell where on the circumference of the circle the various elements were positioned. Assuming that he was standing next to a tall monument with a determined height (in this case, the Capitol), Alberti could determine the distance of those elements from his viewpoint with a simple astrolabe instrument.

Jean-Roch’s astrolabe

This particular astrolabe is a modern rendition of the historical tool used by philosophers, astronomers, mathematicians and builders alike for hundreds of years and still functions in the same way. In short, it is a projection of the sky on a two dimensional surface specific to the viewers geographical coordinates, that can be used to compute various information. Since the location of the different constellations is in constant movement in the sky as the Earth rotates around the sun and on itself, the astrolabe can easily compute the location of various celestial bodies at a precise date and time. Furthermore, since the projection of the sky varies greatly in regards to the user’s latitude and longitude, different sky maps called Plates are placed on the astrolabe, which makes it a site specific tool.
On the Plate of the astrolabe are the projections of different astronomical concepts which are fixed: the Tropic of Capricorn is represented by the outer ring, the Tropic of Cancer by the inner ring and the Equator by the middle ring (the Tropics would be reversed if the astrolabe was to be used in the southern hemisphere). The Almucantar and Azimuth lines are drawn in concordance to the latitude of the user: they represent a grid that is used to locate objects in relation to the horizon, the zenith (at the centre of the Almucantar rings), east and west as well as north and south. On the circumference of the Plate are the 24 hours of the day numbered in clockwise direction.
On top of the Plate is the Rete, which represents a projection of the celestial sphere that can be rotated on the fixed Plate. It consists of the Ecliptic of the sun’s path represented by an offset circle and the most important stars and constellations represented by arrows or dots. Over the Rete is the Rule, which is used to relate the hours of the day to the location of the sun in the sky.
In order to correctly read the astrolabe, you have to position the top of the Plate called the Throne due south, and look at it as you would at a map. In order to know the location of celestial objects at a specific date and time, turn the Rule the the corresponding Zodiac Scale of today’s date (usually found on the backside of the astrolabe) along the sun’s Ecliptic. Turn both Rule and Rete so that the Rule points at the correct time of the day. The end result is a map of the current sky, where the position of objects is read by their degree above the horizon, and degree north or south of east or west. For example, on October 4th (Libra 11) at 4pm, Altair is located at 35 degrees above the horizon, 30 degrees south of east.

Estelle-Carte de Rome par la Méthode d’Alberti

Image

A l’aide d’instruments mathématique, Alberti a enregistré les passages, lieux de cultes, voieries, de la ville de rome. De plus dans ce texte il explique avoir inventé une machine permettant la représentation de n’importe quelle surface (de grande taille) par une utilisation très simple (pour une personne « d’intelligence moyenne »).

Alberti nous explique ensuite la procédure à suivre afin de représenter cette surface ; ainsi il faut décider en premier lieu de la taille du lieu sur lequel on souhaite travailler, puis de décider de l’horizon, c’est-à-dire un cercle qui entoure la représentation de la ville. Il est ainsi divisé en 48 parties égales appelées degrès. Le 1 correspondant au Nord, on a donc le 12 pour l’Est, le 24 pour le sud et le 36 correspondant à l’Ouest.

Chaque degré est ensuite re-divisé en 4 sous parties, qu’Alberti nomme minutes.

A partir de là il réalise « the spoke » dont la longueur doit être égale à la moitié du diamètre du cercle puis divisé en 50 parties égales puis à la manière du cercle d’horizon redivisé en 4 sous parties appelées minutes.

Dans les tableaux suivants on voit deux colonnes, la première celle de l’horizon, la seconde celle du spoke, un chiffre dans la colonne horizon doit par exemple se reporter au dessin de l’horizon, soit le cercle contenant les 48 degrés.

Estelle’s Replication of Apianus Lunar volvelle

Une horloge lunaire permettant de déterminer l’heure de la nuit ou de trouver la phase lunaire

La volvelle présentée est issue du livre Cosmographiae introductio  (publié en 1529) de Petrus Apianus( 1495-1552).

Apianus était un astronome et mathématicien Allemand du 16ème siècle dont l’œuvre est principalement connu pour ses travaux d’astronomie (conçoit des astrolabes, des volvelles, des cadrans solaires..) mais aussi car il fut l’un des premiers à proposer l’observation des mouvements de la lune pour déterminer sa longitude.

A la fois astronome et imprimeur il publia plusieurs ouvrages qui devinrent rapidement célèbres pour leur qualités Tous ces travaux lui valurent reconnaissance de l’empereur Charles Quint dont il devint le mathématicien.

La volvelle reconstituée est une horloge lunaire qui permet de déterminer l’heure de la nuit par le biais des rayons lunaires. Présentée initialement dans le livre d’Apianus, elle se compose de trois disques : le disque fixe  composé des 12 heures du jour et des 12 heures de la nuit, du disque lunaire qui affiche les 12 mois de l’année ainsi que les jours, et du disque interne qui permet d’afficher la phase lunaire.

Afin de déterminer l’heure il faut dans un premier temps utilisé un cadran solaire à la manière d’une moondial, qui donnera l’angle horaire de la lune, puis à l’aide du premier disque (disque interne) on indiquera la phase dans laquelle se trouve la lune. Ensuite, on pivote le second disque (disque lunaire) sous le 1er afin d’afficher la date, et cela nous indique donc l’heure de la nuit.

Si cette volvelle est un outil pour de déterminer l’heure de la nuit, à l’inverse, elle permet de trouver la phase dans laquelle se trouve la lune à partir de l’heure.
Volvelle Lunaire d'Apianus

Wan Lu’s map of Rome

It is hand drawn on black cardboard.

Leno Battista Alberti delineated the city of Rome used the instrument made by his own based on the principle of perspective and mathematics. He recorded the lineation of the walls, the river , the streets, the temples the outlines of the hills of the city Rome. His mathematical way of delineating is functional without measuring the actual distance, and his map is remarkable precise compared to the easiness of the way of measuring.

The instrument had two parts, a circle that acting as horizon, which indicates the size of the map, and a rod “spoke”. Each of them was divided to certain subdivisions, which in his description he divided them into 50 degrees and 4 minutes for one degree each to make it precise. The horizon was marked the four directions, the east, the west, the south and the north.

Then he set several points on the city walls and rivers based on their corners and the point that their curvature reached the highest. He also marked several important location in the city such as the Portas. He chose the capito as his measuring point because it is the tallest building in Rome and he could oversee all the locations from there. By using the rule of perspective he measured the relatively distance and angle of those locations from his standing point on his instrument, and filled in the table with the measurements. After that, he used those measurements to mark those points on his map of Rome and connects them based on the corners and curvatures. In this way he made his delineation of the city Rome.